This guide will explain to you the impact of freezers, how you can make them greener and how to maintain them properly.
Concise, applied and easy to understand.
Let’s start with the fundamentals: the impact of fridges and freezers:
To this day, there is not a single comprehensive life cycle analysis available for a -80°C ultra-low temperature (ULT) freezer. The same goes for lab fridges.
Therefore, I went through the available data and, where necessary, translated findings from commercial fridges to our situation. Although tedious, the data was surprising:
Manufacturing Impact
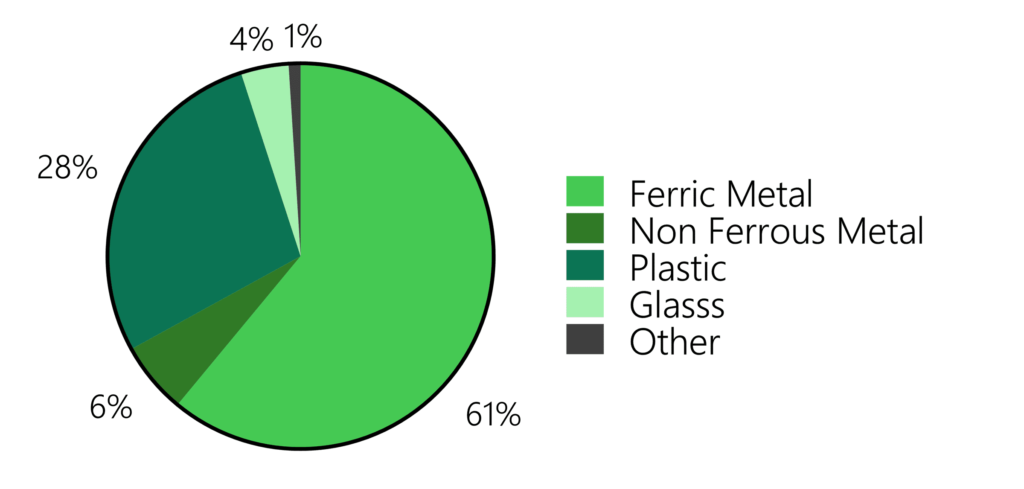
A typical household fridge weighs 60–150 kg and is made from a wide range of materials, including stainless steel, aluminum, copper, polystyrene, tempered glass, acrylics, and polyurethane foam.
The carbon footprint of manufacturing such a fridge is around 200–800 kg CO₂e. Walk-in refrigeration units or those used in supermarkets have accordingly higher impacts.
Lab freezers, are somewhat heavier: a 500 L -80°C freezer weighs 240–340 kg, meaning its estimated manufacturing footprint is 600–900 kg CO₂e.
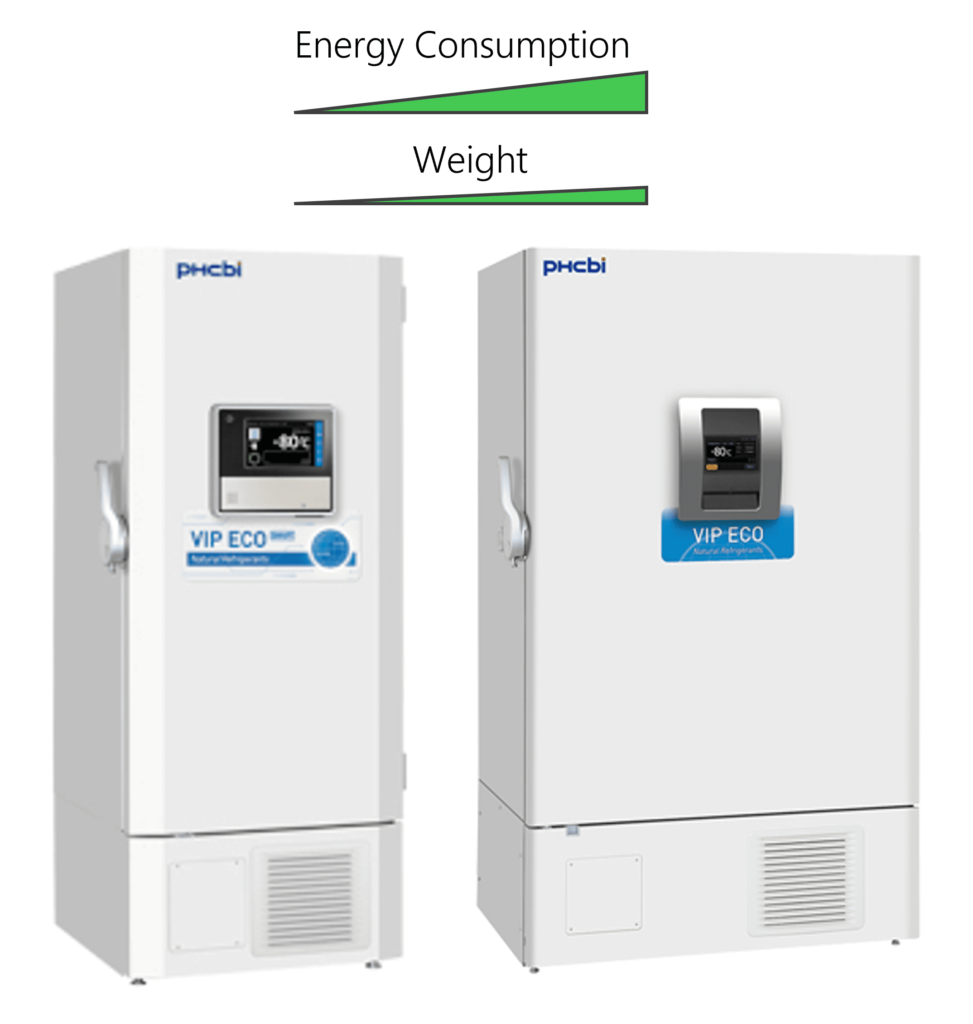
Interestingly, larger 700+ L models weigh roughly the same (260–315 kg), resulting in a similar manufacturing footprint.
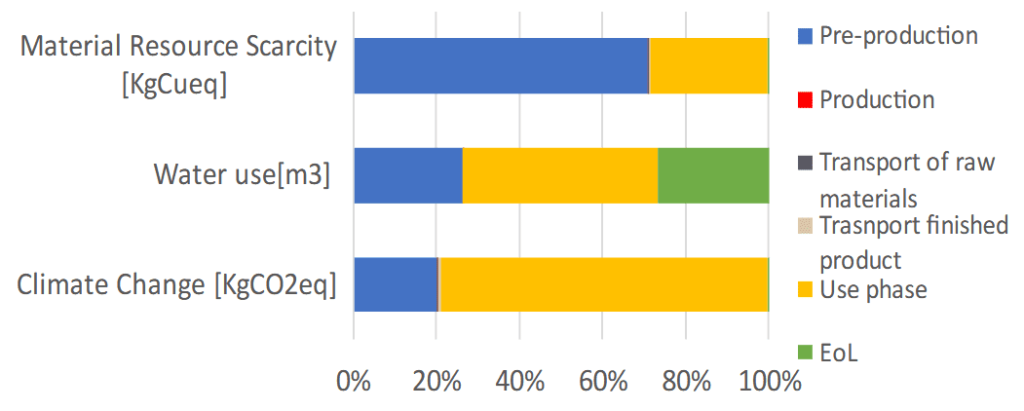
Energy Consumption – The Biggest Factor
Most of a freezer’s footprint comes not from its production but from its electricity use. The ongoing impact is as follows:
Household fridge:
- 1–2 kWh/day → 0.64 kg CO₂/day
- 77–234 kg CO₂/year
-80°C freezers (500+L, assuming 341 g CO₂/kWh in Germany):
- Very old model: 36 kWh/day → 4,480 kg CO₂/year
- Newer model: 12 kWh/day → 1,493 kg CO₂/year
- Best model available: 7 kWh/day → 871 kg CO₂/year
Of note, these are compressor-based fridges—i.e., they use a compressor for cooling. For -70/-80°C, these are the most common models. However, some units use liquid nitrogen (especially for -130°C) for cooling, resulting in a very different life cycle composition.
Refrigerants
In short, a refrigerant is a substance used in cooling systems to absorb and release heat, enabling refrigeration and air conditioning.
It cycles through phase changes (liquid ↔ gas) to transfer heat efficiently.
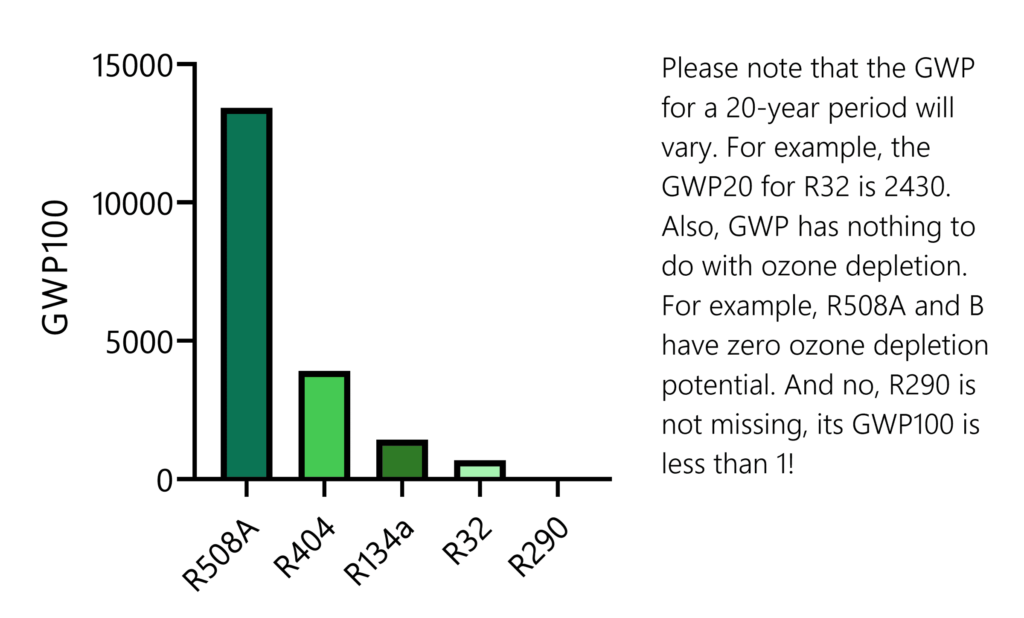
Why does this matter? Because refrigerants have an enormous climate impact when leaked. For instance, assuming a 50% refrigerant recovery during disposal:
- A small -20°C freezer (R134a) → 71.5–143 kg CO₂e impact at disposal
- A -80°C freezer (R404 & R508) → 2,000–3,631 kg CO₂e impact at disposal
Due to a 2–15% leakage rate per year, full recovery is impossible, and occasional refilling is required. On top of that, illegal disposal and improper handling remain widespread.
End-of-Life
The end-of-life impact, including disposal, plays a smaller role in the overall footprint.
Estimates range between 0.25–15 kg CO₂e.
(Deeper discussion about potential false assumptions in our Slack)
Transportation to the landfill is likely a significant contributor. Additionally, we need to account for the energy consumption of hulk shredding (approx. 144 J/kg) and material separation.
Typical recycling rates look something like steel, aluminum, and copper: Recycled at 37%, 32%, and 22% by weight, respectively. Plastics and residue: 20% incinerated, 80% landfilled.
When Should You Exchange Your Freezer?
A fridge has a total footprint of about 2000-8000 kg CO₂e over a 10-year lifespan. For a -80°C freezer, that number is closer to 20 000–
50 000 kg CO₂e. (More in our free Slack).
Let’s summarize:
- Financially: The cost of a new freezer amortizes over 5–10 years, depending on energy prices.
- Environmentally: The footprint amortizes in 2–5 years due to massive energy savings.
Compared to a 500+L model, the 700+ L energy consumption increases by roughly 30%, meaning faster amortization in environmental terms.
Bottom line:
- If your freezer is 15+ years old → Definitely replace it.
- If your freezer is 10+ years old → Replacement is likely a good decision.
- If your freezer is 5+ years old → Debatable, analysis recommended
Making Freezers More Sustainable
Quick Aside: The global freezer market in 2022 was estimated at a staggering $4.7 billion. However, by 2030, estimates predict it will grow to between $7.4 billion and $12.7 billion. While the EU and US markets are the largest, Asian markets are expanding rapidly. Nevertheless, it is notable that Africa and South America—despite having significantly hotter climates—accounted for less than 5% of the market in 2024
As we discussed, the biggest environmental impact of ultra-low temperature (ULT) freezers comes from their use phase. But how big is their energy consumption compared to other lab equipment?
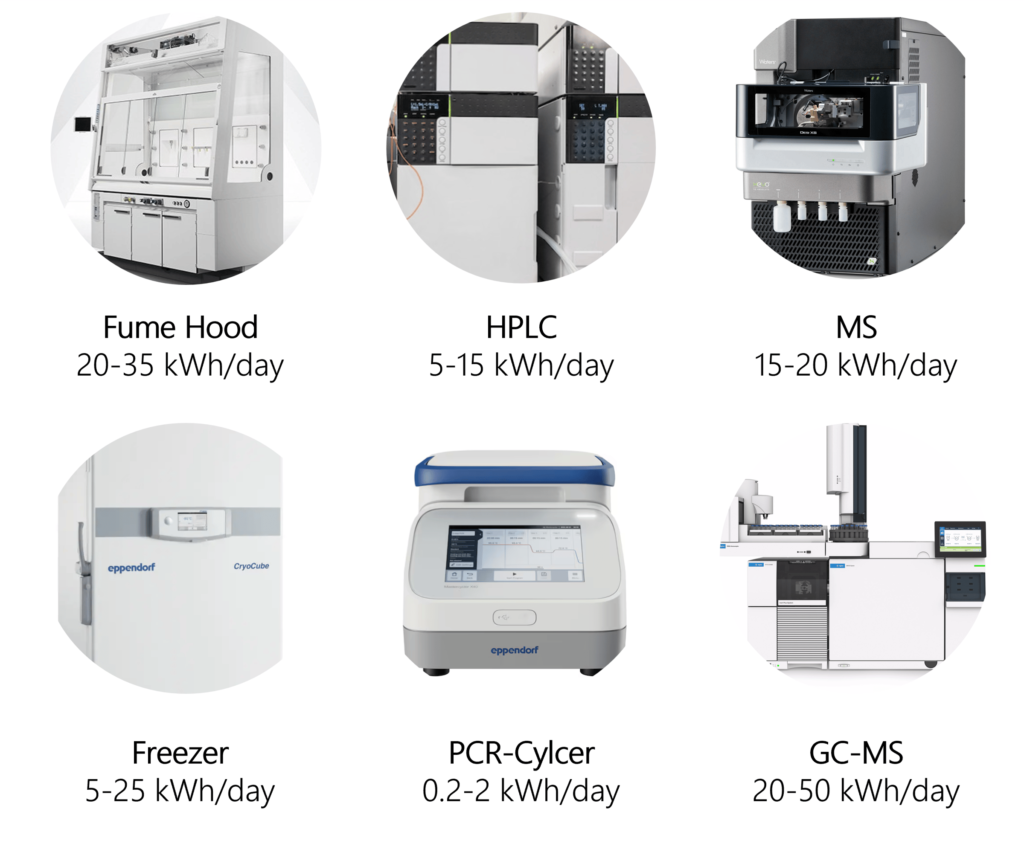
The average energy consumption of a freezer per year ranges between 2.5 – 9.1 million Wh. An average American household consumes between 9 and 11 million Wh per year. Thus, only the older models consume more energy than an entire home!
Now that we have a sense of scale, let’s explore how to minimize freezer energy consumption as much as possible.
Purchasing
At first, choosing a freezer with lower energy consumption will be environmentally beneficial.
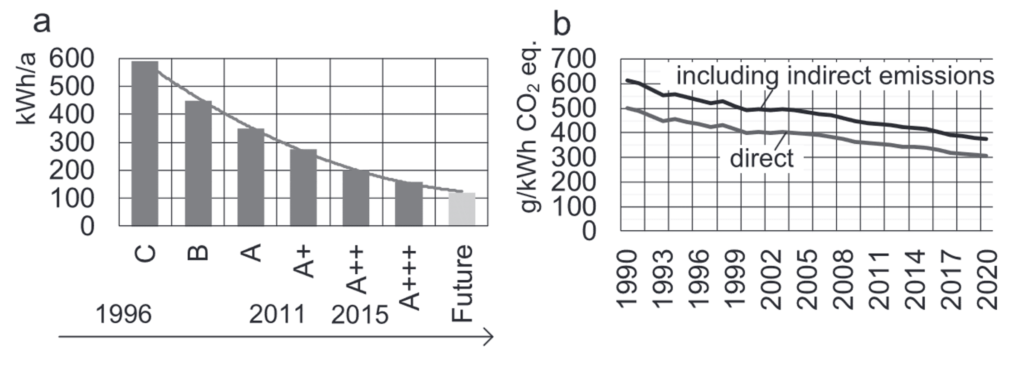
Modern ULT freezers have become significantly more energy efficient over the past few decades.
A 500+ L model from before 2000 can be expected to use up to 36 kWh/day, whereas models from the 2000s–2005s typically consume around 19 kWh/day.
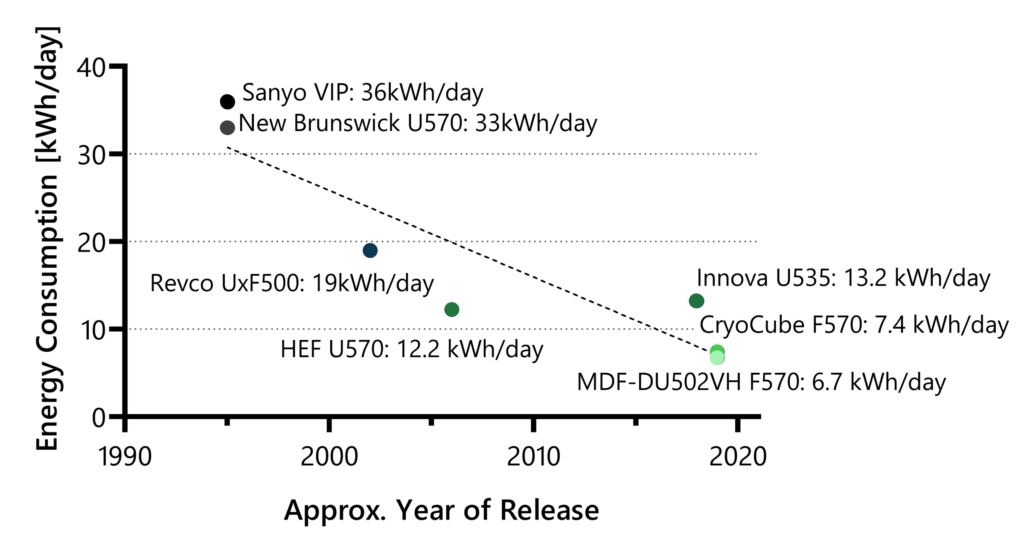
More recent models have further improved efficiency, consuming between 7–12 kWh/day, with the most efficient freezer currently available (PHCBI) using just 4.99 kWh/day.
These efficiency gains are the result of multiple technological advances:
- Improved heat exchange designs optimize cooling performance.
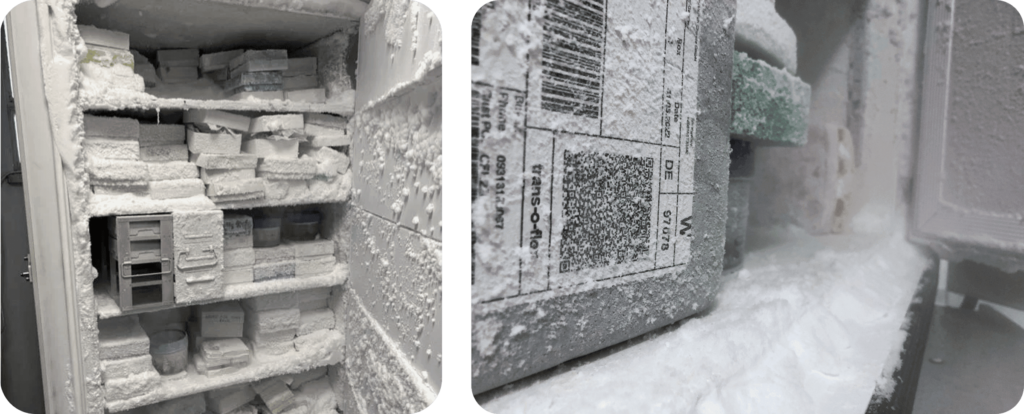
- Vacuum-insulated panels have replaced polyurethane foam, reducing heat loss.
- Variable-speed and dual-stage compressors adjust power dynamically, operating only at the minimum required level rather than running at full power constantly.
However, even the best freezers age. Every year, energy consumption increases by approximately 1-3%, which can easily translate to an additional 8.75 kg of CO₂e per month.
Adjusting Set Temperatures
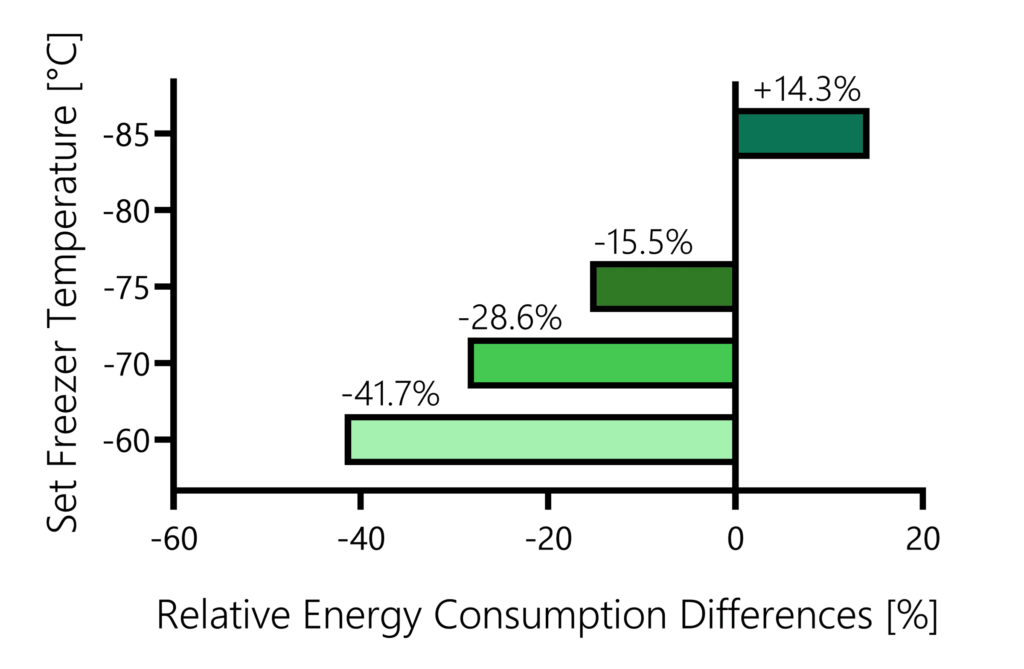
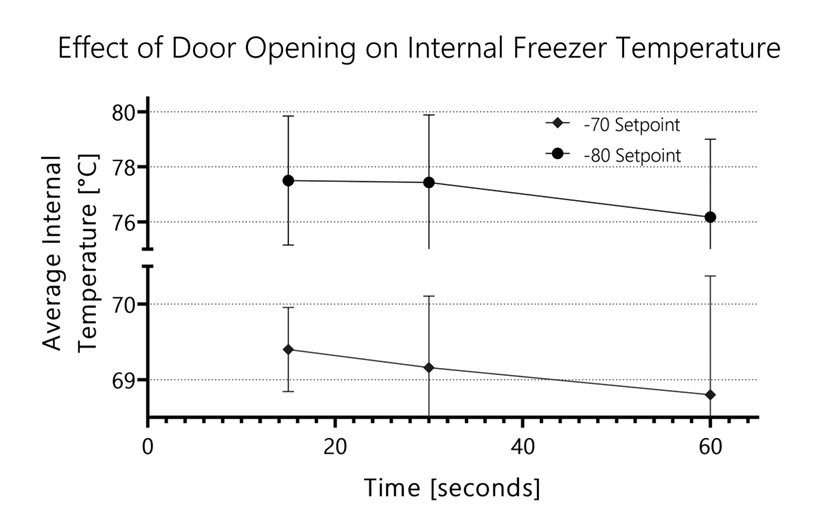
The single most impactful change a lab can make is adjusting freezer temperatures from -80°C to -70°C or lower.
Based on studies from the University of Copenhagen, together with an investigation by Farley et al., and manufacturer data, we can confidently say that raising the temperature from -80°C to -70°C reduces energy consumption by 22–29%!
In fact, -70°C was the standard for decades before improvements in cooling technology made -80°C the norm—not for scientific reasons, but because it became a marketing advantage.
Published studies further confirm that sample stability is not affected:
- Espinel-Ingroff et al. successfully recovered 6,000+ yeast and 300+ mold samples after 10 years of storage at both -70°C and -80°C.
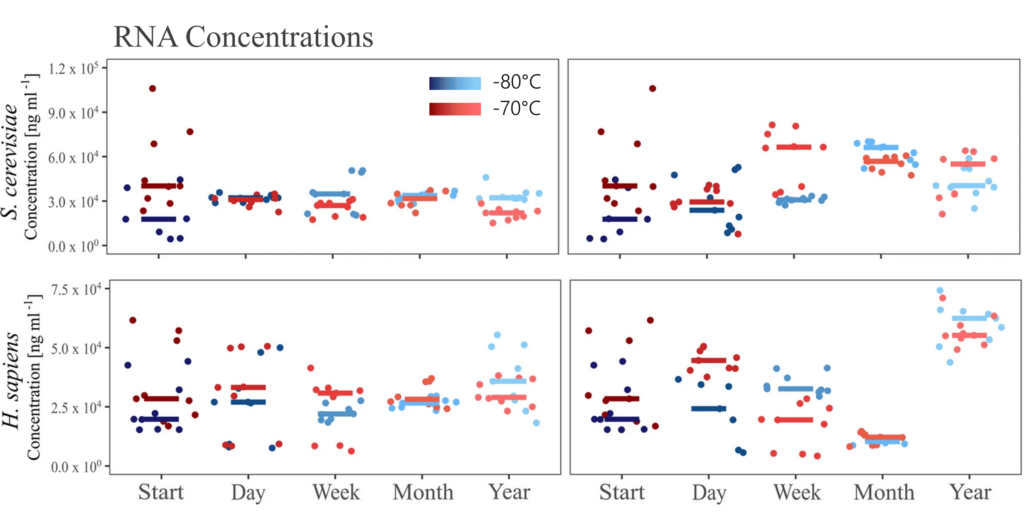
- Landor et al. found no significant degradation in DNA and RNA stored at -70°C, with only minor 260/230 ratio variations, all well below standard deviation ranges.
- Paraoxonase-1 enzyme activity remained unchanged after one year of storage at -70°C
Even manufacturers acknowledge this—QIAGEN officially recommends storing RNA at -70°C.
And it’s not just ULT freezers—adjusting standard freezers from -25°C to -20°C has been shown to reduce energy consumption by 20%, as reported by EPFL in Switzerland.
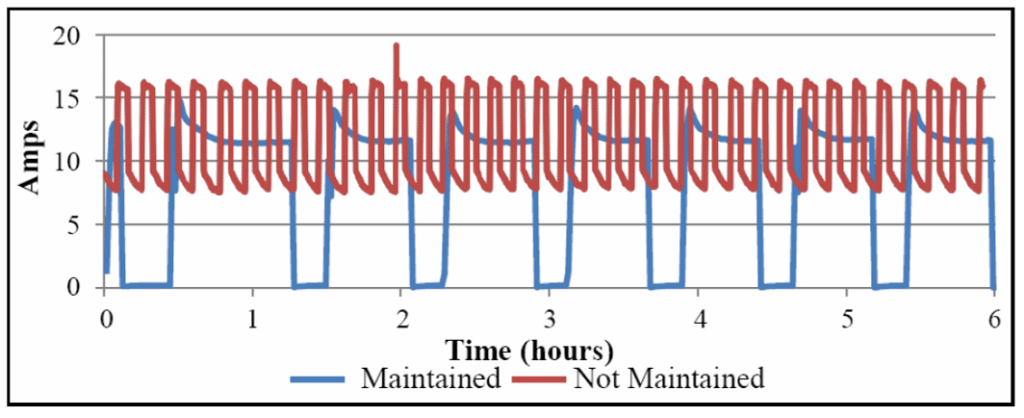
The Role of Proper Setup and Maintenance
Aside from temperature adjustments, proper installation and maintenance can significantly reduce a freezer’s energy consumption.
A study by Gumapas et al. analyzed four freezers (20–25 kWh/day) under different conditions and found several key factors:
Controlling Ambient Temperature
- Each 1°C increase in room temperature leads to 18 kWh of extra energy use per month, releasing an additional 9.27 kg of CO₂e. (+ don’t place freezers at windows/in the sun)
Avoiding Dust Accumulation
- Regular cleaning can save 211 kWh per month, preventing 108 kg of CO₂e emissions.
- Declogging filters alone reduced energy consumption by 117 kWh per month, or 60 kg of CO₂e.
Ensuring Ventilation
- In their case, poor ventilation increases the duty cycle by 4%, leading to an additional 85 kWh of electricity used per month (equivalent to 51 kg of CO₂e).
Removing Ice
- Heavy ice accumulation can increase energy use by up to 50%, forcing the compressor to work harder to maintain low temperatures.
(Next week more on how to clean your freezer)
Some Important Questions:
Should You Purchase Larger Freezers?
Older studies suggest that larger freezers were more about 13% for efficient. However, this depends on the manufacturer. While such a difference is still exists for PHCBI models, they do not in Eppendorf ULTs.
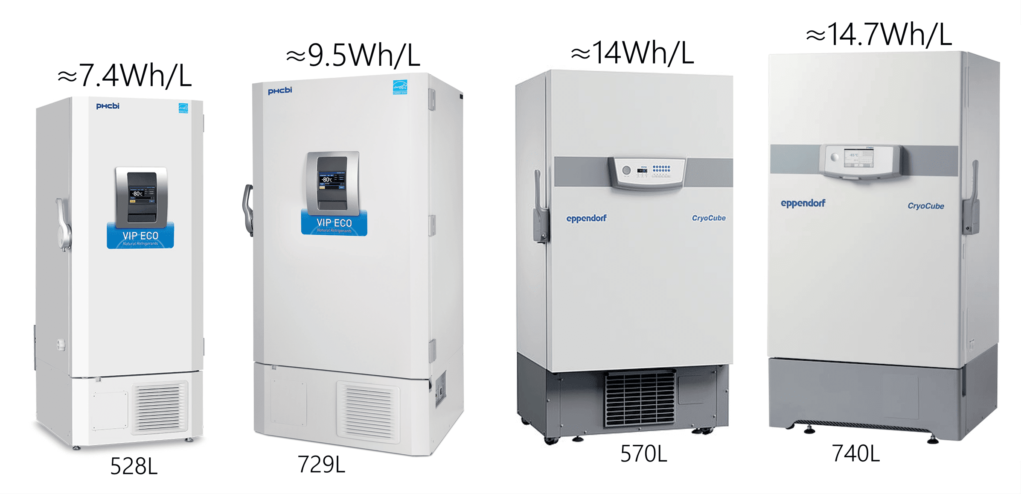
Of note, upright freezers tend to consume less electricity than chest freezers.
How to Convince Colleagues to Switch to -70°C
If your lab is hesitant, the best strategy is to start with one freezer and demonstrate that it is completely safe.
In fact, due to reduced compressor load, freezers set to -70°C are less likely to fail under suboptimal maintenance or when air conditioning struggles to keep up.
If you would like to demonstrate how much money can be saved though purchasing more efficient freezers, PHCBI has a simple online tool (just note that their competitors have newer models with smaller energy consumption).
Maintaning Freezers Sustainably
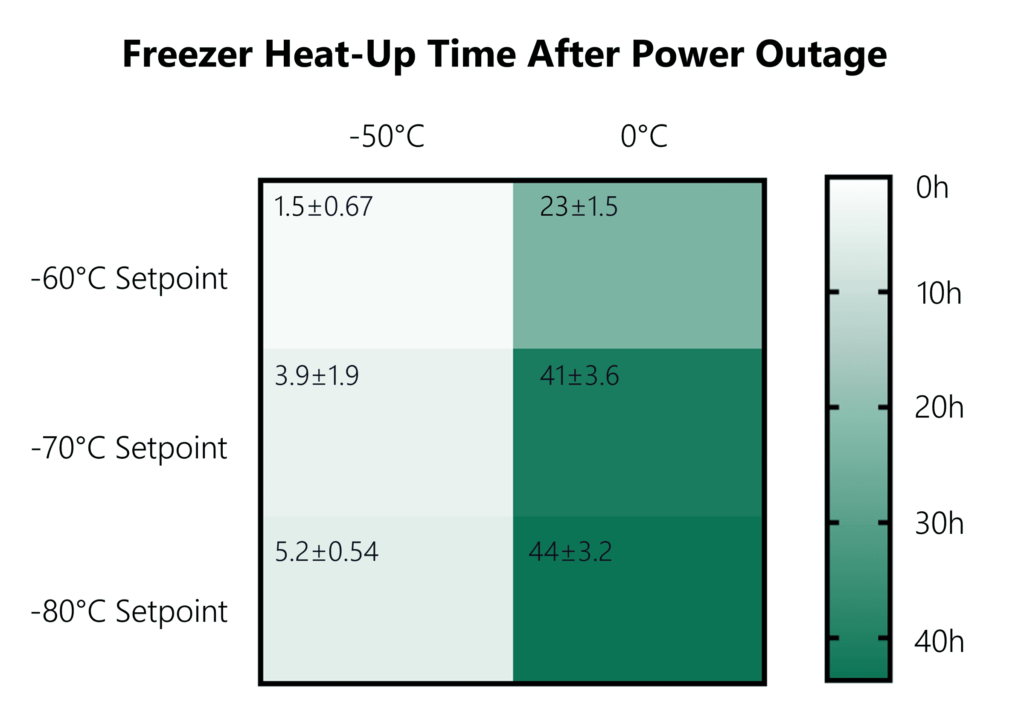
If your freezer fails, you have only a few hours before it reaches temperatures that could harm your samples. Therefore, prevention is key.
Although Proper freezer and sample maintenance can save a lot of energy, it also will:
A) Safeguard samples from being lost.
B) Prevent unnecessary failures and reduce search time.
C) Maintain freezer health, as frequent openings and insufficient cleaning are the main causes of failure.
Sample Organization
Each time the door is opened, warm air enters, forcing the compressor restore lower temperatures. Additionally, this leads to ice buildup on the lid, increasing the risk of compressor overload due to constant warm air exposure.
However, a well-organized system comes with further advantages for your science:
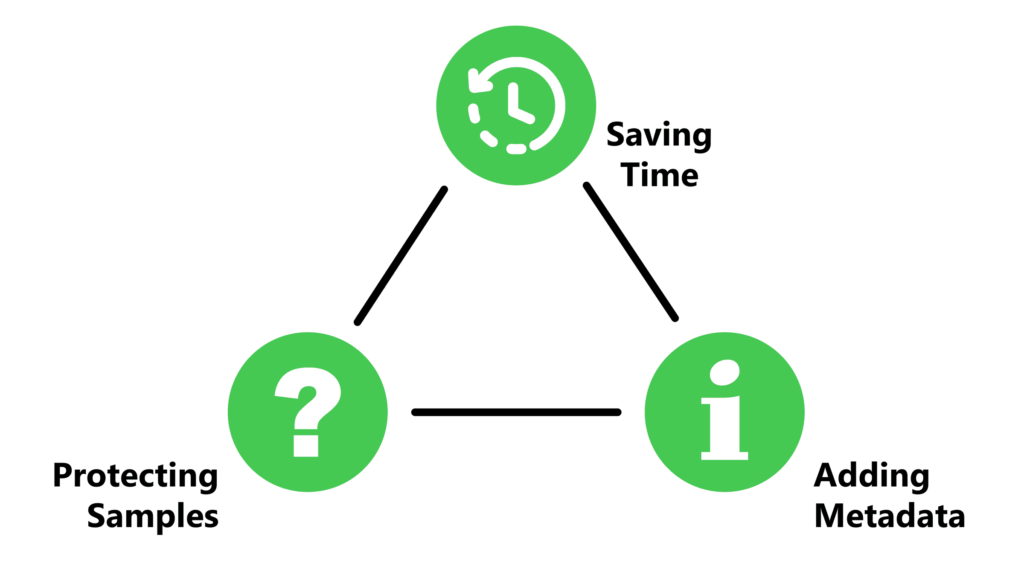
1. Reduces time needed for searching samples.
2. Prevents samples from being lost or forgotten (consider the high turnover of people in laboratories).
3. Ensures detailed sample metadata, which, if missing, might lead to misleading results:
- Experiment-specific notes (e.g., genetic variations in bacterial strains, passage number for cell cultures, source of biological material).
- Treatment conditions (e.g., exposure to chemicals, storage buffer composition).
- Tracking expiration dates to prevent unnecessary rework or contamination from degraded samples.
How to?
The simplest and cheapest approach is an Excel-based tracking system.
Here is our short guide on how to create such a system, along with a ready-made template.
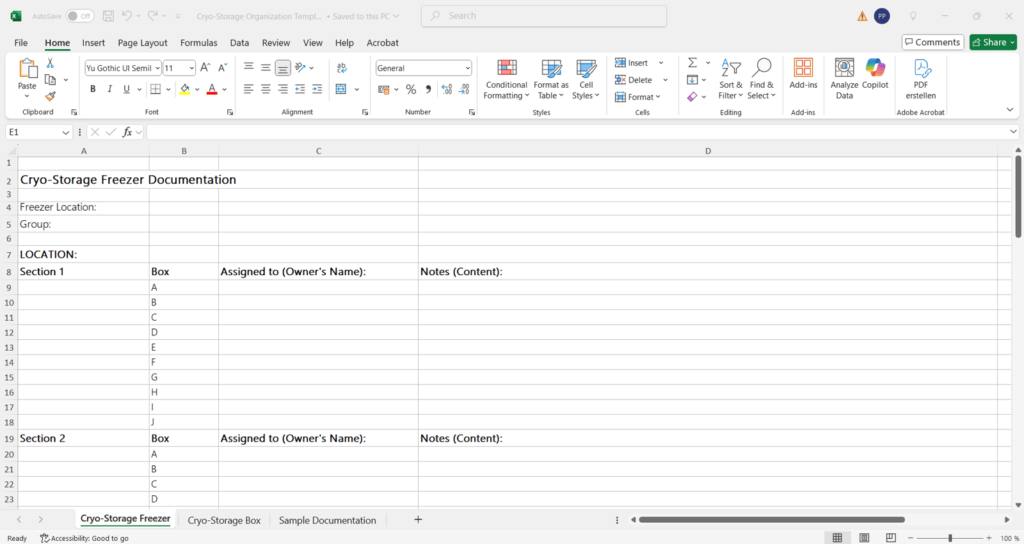
In short, you use one sheet to track each type of sample/reagent and one for each freezer.
While an Excel system is highly customizable and cost-effective, it requires manual updates and is prone to human error.
Otherwise, you can decide for an automated solution – using a sample management software and QR codes that are readable with with a smartphone.
These systems also enable enhanced data storage, including full experimental history and direct links to references or protocols.
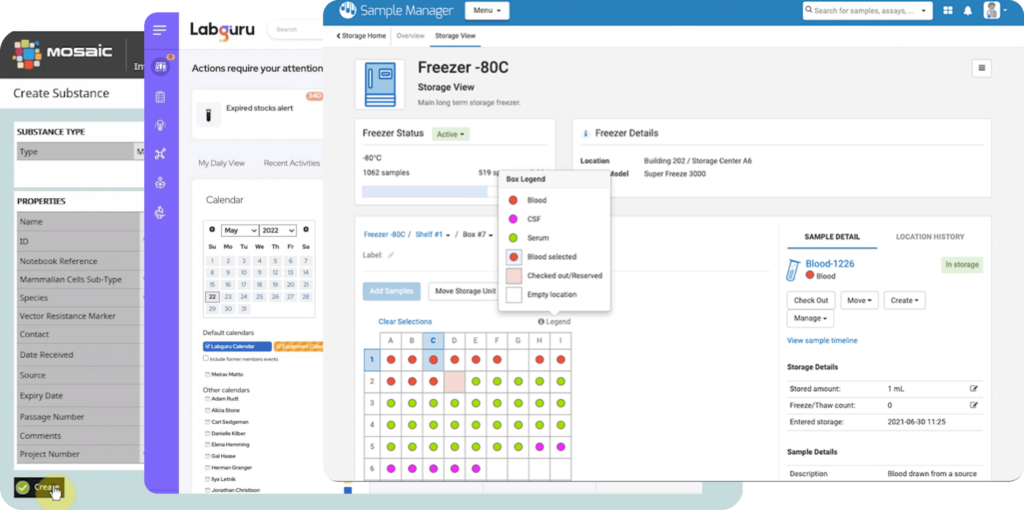
Some software options even synchronize with electronic lab notebooks (ELNs) or provide real-time tracking of reagent usage
However, no matter how well-organized your freezer is, you will still have to open it. Each time you do, humid air enters.
How to Maintain & Clean Your Freezer
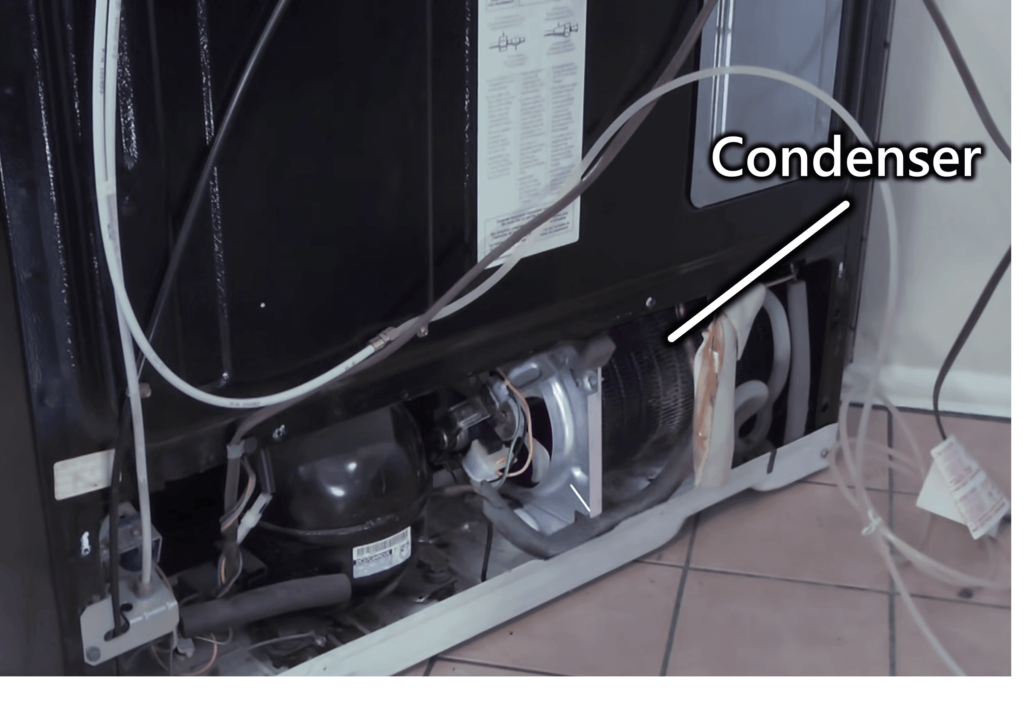
The most common cause of freezer failure is compressor overload, often due to blocked ventilation or insufficient heat transfer.
While the former is typically caused by dust accumulation on the filter, the latter is linked to dust on the condenser coils. Additionally, ice buildup on the gasket/rubber seal can prevent proper closure, forcing the freezer to run constantly to compensate for the air exchange.
The key steps to keeping your freezer in good condition are:
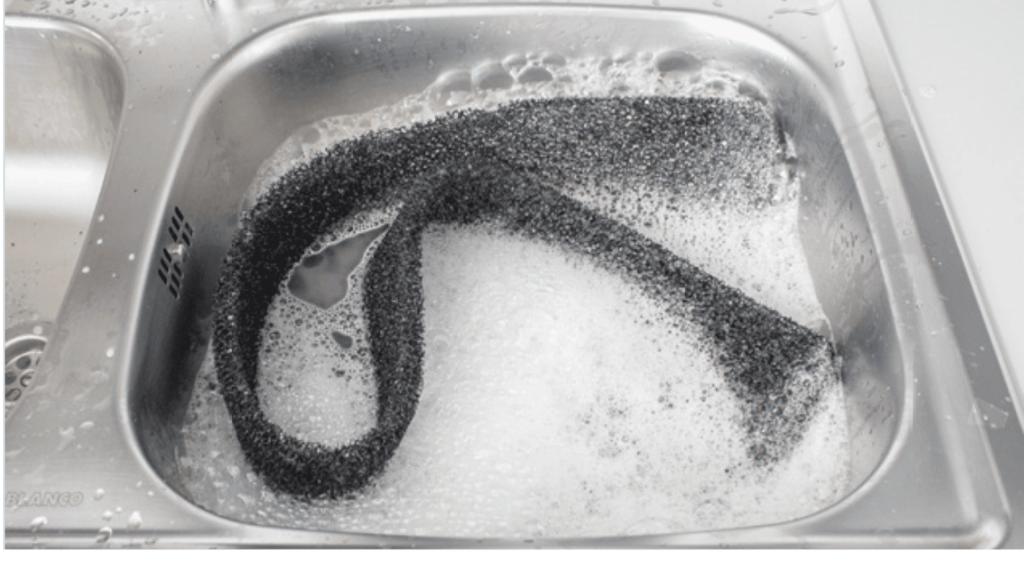
- Cleaning the condenser filter (usually located at the base/back).
- Cleaning the condenser coils.
- Defrosting the freezer.
- Cleaning the vacuum relief port/auto vent port.
- Discarding unnecessary samples
Here’s our easy and concise guide on how to clean your ULT freezer effectively.
Also, this NIH video explains quite well how to clean the filters.
Some Tips For You
While these activities do not generate new data, they ensure your work runs efficiently and that samples remain well-preserved.
Even if your lab members aren’t actively participating, I highly recommend setting up a sample organization system and basic freezer maintenance procedures for yourself. The benefits will become clear once you’ve worked on a project for more than six months.
If you receive positive feedback from your team, use that momentum:
- Schedule routine cleaning in your lab’s maintenance calendar.
- Ensure guides on freezer cleaning and sample documentation are easily accessible. Ideally, store them in the same folder as the actual software/Excel file.
- Provide proper training for team members. If people feel uncertain, they might either avoid the task or do it half-heartedly, leading to mistakes.
Finally, consider joining initiatives like the International Freezer Challenge.
Bonus
As many labs face challenges defrosting their freezers due to limited capacity for temporarily storing their samples, I’ve found a company that offers an excellent solution.
They also provide secure sample storage at various temperatures, with full certification.
Read more here: https://readvance.kit.com/posts/sample-safety-transport